

So far we have seen various bugchecks depicted. What I left there is the explanation of how exceptions happen in the first place and how the execution flow reaches KiDispatchException. When some abnormal condition happens such as breakpoint, division by zero or memory protection violation then normal CPU execution flow (code stream) is interrupted (therefore I use the terms “interrupt” and “exception” interchangeably here). The type of interrupt is specified by a number called interrupt vector number. Obviously CPU has to transfer execution to some procedure in memory to handle that interrupt. CPU has to find that procedure, theoretically either having one procedure for all interrupts and specifying interrupt vector number as a parameter or having a table containing pointers to various procedures that correspond to different interrupt vectors. Intel x86 and x64 CPUs use the latter approach which is depicted on the following diagram:

When an exception happens (divide by zero, for example) CPU gets the address of the procedure table from IDTR (Interrupt Descriptor Table Register). This IDT (Interrupt Descriptor Table) is a zero-based array of 8-byte descriptors (x86) or 16-byte descriptors (x64). CPU calculates the location of the necessary procedure to call and does some necessary steps like saving appropriate registers before calling it.
The same happens when some external I/O device interrupts. We will talk about external interrupts later. For I/O devices the term “interrupt” is more appropriate. On the picture above I/O hardware interrupt vector numbers were taken from some dump. These are OS and user-defined numbers. The first 32 vectors are reserved by Intel.
Before Windows switches CPU to protected mode during boot process it creates IDT table in memory and sets IDTR to point to it by using SIDT instruction.
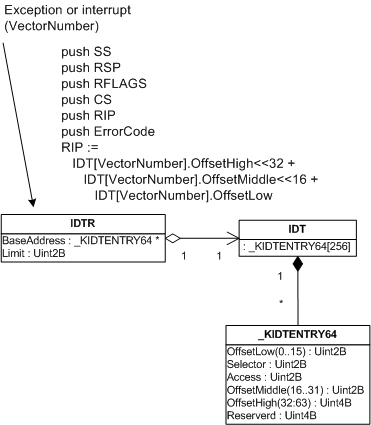
Let me now illustrate this by using a UML class diagram annotated by pseudo-code that shows what CPU does before calling the appropriate procedure. The pseudo-code on the diagram below is valid for interrupts and exceptions happening when the current CPU execution mode is kernel. For interrupts and exceptions generated when CPU executes code in user mode the picture is a little more complicated because the processor has to switch the current user-mode stack to kernel mode stack.
The following diagram is for 32-bit x86 processor (x64 will be illustrated later):
Let’s see all this in some dump. The address of IDT can be found by using !pcr [processor number] command. Every processor on a multiprocessor machine has its own IDT:
0: kd> !pcr 0
KPCR for Processor 0 at ffdff000:
Major 1 Minor 1
NtTib.ExceptionList: f2178b8c
NtTib.StackBase: 00000000
NtTib.StackLimit: 00000000
NtTib.SubSystemTib: 80042000
NtTib.Version: 0005c645
NtTib.UserPointer: 00000001
NtTib.SelfTib: 7ffdf000
SelfPcr: ffdff000
Prcb: ffdff120
Irql: 0000001f
IRR: 00000000
IDR: ffffffff
InterruptMode: 00000000
                 IDT: 8003f400
GDT: 8003f000
TSS: 80042000
CurrentThread: 88c1d3c0
NextThread: 00000000
IdleThread: 808a68c0
DpcQueue:
Every entry in IDT has the type _KIDTENTRY and we can get the first entry for divide by zero exception which has vector number 0:
0: kd> dt _KIDTENTRY 8003f400
+0x000 Offset           : 0x47ca
+0x002 Selector         : 8
+0x004 Access           : 0x8e00
+0x006 ExtendedOffset   : 0x8083
By gluing together ExtendedOffset and Offset fields we get the address of the interrupt handling procedure (0×808347ca) which is KiTrap00:
0: kd> ln 0x808347ca
(808347ca)   nt!KiTrap00   |  (808348a5)   nt!Dr_kit1_a
Exact matches:
nt!KiTrap00
We can also see the interrupt trace in raw stack. For example, we can open the kernel dump and see the following stack trace and registers in the output of !analyze -v command:
ErrCode = 00000000
eax=00001b00 ebx=00001b00 ecx=00000000 edx=00000000 esi=f2178cb4 edi=bc15a838
eip=bf972586 esp=f2178c1c ebp=f2178c90 iopl=0 nv up ei ng nz ac po cy
cs=0008 ss=0010 ds=0023 es=0023 fs=0030 gs=0000 efl=00010293
driver!foo+0xf9:
bf972586 f77d10 idiv eax,dword ptr [ebp+10h] ss:0010:f2178ca0=00000000
STACK_TEXT:
f2178b44 809989be nt!KeBugCheck+0×14
f2178b9c 8083484f nt!Ki386CheckDivideByZeroTrap+0×41
f2178b9c bf972586 nt!KiTrap00+0×88
f2178c90 bf94c23c driver!foo+0xf9
f2178d54 80833bdf driver!bar+0×11c
The dumping memory around ESP value (f2178c1c) shows the values processor pushes when divide by zero exception happens:
0: kd> dds f2178c1c-100 f2178c1c+100
...
...
...
f2178b80  00000000
f2178b84  f2178b50
f2178b88  00000000
f2178b8c  f2178d44
f2178b90  8083a8cc nt!_except_handler3
f2178b94  80870828 nt!`string'+0xa4
f2178b98  ffffffff
f2178b9c  f2178ba8
f2178ba0  8083484f nt!KiTrap00+0x88
f2178ba4  f2178ba8
f2178ba8  f2178c90
f2178bac  bf972586 driver!foo+0xf9
f2178bb0  badb0d00
f2178bb4  00000000
f2178bb8  0000006d
f2178bbc  bf842315
f2178bc0  f2178c6c
f2178bc4  f2178bec
f2178bc8  bf844154
f2178bcc  f2178c88
f2178bd0  f2178c88
f2178bd4  00000000
f2178bd8  bc150000
f2178bdc  f2170023
f2178be0  f2170023
f2178be4  00000000
f2178be8  00000000
f2178bec  00001b00
f2178bf0  f2178c0c
f2178bf4  f2178d44
f2178bf8  f2170030
f2178bfc  bc15a838
f2178c00  f2178cb4
f2178c04  00001b00
f2178c08  f2178c90
f2178c0c  00000000 ; ErrorCode
f2178c10  bf972586 driver!foo+0xf9 ; EIP
f2178c14  00000008 ; CS
f2178c18  00010293 ; EFLAGS
f2178c1c  00000000 ; <- ESP before interrupt
f2178c20  0013c220
f2178c24  00000000
f2178c28  60000000
f2178c2c  00000001
f2178c30  00000000
f2178c34  00000000
…
…
…
ErrorCode is not the same as interrupt vector number although it is the same number here (0). I won’t cover interrupt error codes here. If you are interested please consult Intel Architecture Software Developer’s Manual.
If we try to execute !idt extension command it will show you only user-defined hardware interrupt vectors:
0: kd> !idt
Dumping IDT:
37: 80a7d1ac hal!PicSpuriousService37
50: 80a7d284 hal!HalpApicRebootService
51: 89495044 serial!SerialCIsrSw (KINTERRUPT 89495008)
52: 89496044 i8042prt!I8042MouseInterruptService (KINTERRUPT 89496008)
53: 894ea044 USBPORT!USBPORT_InterruptService (KINTERRUPT 894ea008)
63: 894f2044 USBPORT!USBPORT_InterruptService (KINTERRUPT 894f2008)
72: 89f59044 atapi!IdePortInterrupt (KINTERRUPT 89f59008)
73: 89580044 NDIS!ndisMIsr (KINTERRUPT 89580008)
83: 899e7824 NDIS!ndisMIsr (KINTERRUPT 899e77e8)
92: 89f56044 atapi!IdePortInterrupt (KINTERRUPT 89f56008)
93: 89f1e044 SCSIPORT!ScsiPortInterrupt (KINTERRUPT 89f1e008)
a3: 894fa044 USBPORT!USBPORT_InterruptService (KINTERRUPT 894fa008)
a4: 894a3044 cpqcidrv+0×22AE (KINTERRUPT 894a3008)
b1: 89f697dc ACPI!ACPIInterruptServiceRoutine (KINTERRUPT 89f697a0)
b3: 89498824 i8042prt!I8042KeyboardInterruptService (KINTERRUPT 894987e8)
b4: 894a2044 cpqasm2+0×5B99 (KINTERRUPT 894a2008)
c1: 80a7d410 hal!HalpBroadcastCallService
d1: 80a7c754 hal!HalpClockInterrupt
e1: 80a7d830 hal!HalpIpiHandler
e3: 80a7d654 hal!HalpLocalApicErrorService
fd: 80a7e11c hal!HalpProfileInterrupt
As I promised in Part 1, I describe changes in 64-bit Windows. The size of IDTR is 10 bytes where 8 bytes hold 64-bit address of IDT. The size of IDT entry is 16 bytes and it holds the address of an interrupt procedure corresponding to an interrupt vector. However interrupt procedure names are different in x64 Windows, they do not follow the same pattern like KiTrapXX.
The following UML class diagram describes the relationship and also shows what registers are saved. In native x64 mode SS and RSP are saved regardless of kernel or user mode.
Let’s dump all architecture-defined interrupt procedure names. This is a good exercise because we will use scripting. !pcr extension reports wrong IDT base so we use dt command:
kd> !pcr 0
KPCR for Processor 0 at fffff80001176000:
Major 1 Minor 1
NtTib.ExceptionList: fffff80000124000
NtTib.StackBase: fffff80000125070
NtTib.StackLimit: 0000000000000000
NtTib.SubSystemTib: fffff80001176000
NtTib.Version: 0000000001176180
NtTib.UserPointer: fffff800011767f0
NtTib.SelfTib: 000000007ef95000
SelfPcr: 0000000000000000
Prcb: fffff80001176180
Irql: 0000000000000000
IRR: 0000000000000000
IDR: 0000000000000000
InterruptMode: 0000000000000000
IDT: 0000000000000000
GDT: 0000000000000000
TSS: 0000000000000000
CurrentThread: fffffadfe669f890
NextThread: 0000000000000000
IdleThread: fffff8000117a300
DpcQueue:
kd> dt _KPCR fffff80001176000
nt!_KPCR
+0×000 NtTib            : _NT_TIB
+0×000 GdtBase          : 0xfffff800`00124000 _KGDTENTRY64
+0×008 TssBase          : 0xfffff800`00125070 _KTSS64
+0×010 PerfGlobalGroupMask : (null)
+0×018 Self             : 0xfffff800`01176000 _KPCR
+0×020 CurrentPrcb      : 0xfffff800`01176180 _KPRCB
+0×028 LockArray        : 0xfffff800`011767f0 _KSPIN_LOCK_QUEUE
+0×030 Used_Self        : 0×00000000`7ef95000
+0×038 IdtBase          : 0xfffff800`00124070 _KIDTENTRY64
+0×040 Unused           : [2] 0
+0×050 Irql             : 0 ”
+0×051 SecondLevelCacheAssociativity : 0×10 ”
+0×052 ObsoleteNumber   : 0 ”
+0×053 Fill0            : 0 ”
+0×054 Unused0          : [3] 0
+0×060 MajorVersion     : 1
+0×062 MinorVersion     : 1
+0×064 StallScaleFactor : 0×892
+0×068 Unused1          : [3] (null)
+0×080 KernelReserved   : [15] 0
+0×0bc SecondLevelCacheSize : 0×100000
+0×0c0 HalReserved      : [16] 0×82c5c880
+0×100 Unused2          : 0
+0×108 KdVersionBlock   : 0xfffff800`01174ca0
+0×110 Unused3          : (null)
+0×118 PcrAlign1        : [24] 0
+0×180 Prcb             : _KPRCB
Next we dump the first entry of IDT array and glue together OffsetHigh, OffsetMiddle and OffsetLow fields to form the interrupt procedure address corresponding to the interrupt vector 0, divide by zero exception:
kd> dt _KIDTENTRY64 0xfffff800`00124070
nt!_KIDTENTRY64
+0x000 OffsetLow        : 0xf240
+0x002 Selector         : 0x10
+0x004 IstIndex         : 0y000
+0x004 Reserved0        : 0y00000 (0)
+0x004 Type             : 0y01110 (0xe)
+0x004 Dpl              : 0y00
+0x004 Present          : 0y1
+0×006 OffsetMiddle     : 0×103
+0×008 OffsetHigh       : 0xfffff800
+0×00c Reserved1        : 0
+0×000 Alignment        : 0×1038e00`0010f240
kd> u 0xfffff8000103f240
nt!KiDivideErrorFault:
fffff800`0103f240 4883ec08 sub rsp,8
fffff800`0103f244 55 push rbp
fffff800`0103f245 4881ec58010000 sub rsp,158h
fffff800`0103f24c 488dac2480000000 lea rbp,[rsp+80h]
fffff800`0103f254 c645ab01 mov byte ptr [rbp-55h],1
fffff800`0103f258 488945b0 mov qword ptr [rbp-50h],rax
fffff800`0103f25c 48894db8 mov qword ptr [rbp-48h],rcx
fffff800`0103f260 488955c0 mov qword ptr [rbp-40h],rdx
kd> ln 0xfffff8000103f240
(fffff800`0103f240) nt!KiDivideErrorFault |
(fffff800`0103f300) nt!KiDebugTrapOrFault
Exact matches:
nt!KiDivideErrorFault = <no type information>We see that the name of the procedure is KiDivideErrorFault and not KiTrap00. We can dump the second IDT entry manually by adding a 0×10 offset but in order to automate this I wrote the following WinDbg script to dump the first 20 vectors and get their interrupt procedure names:
r? $t0=(_KIDTENTRY64 *)0xfffff800`00124070; .for (r $t1=0; @$t1 <= 13; r? $t0=(_KIDTENTRY64 *)@$t0+1) { .printf “Interrupt vector %d (0x%x):\n”, @$t1, @$t1; ln @@c++(@$t0->OffsetHigh*0×100000000 + @$t0->OffsetMiddle*0×10000 + @$t0->OffsetLow); r $t1=$t1+1 }Here is the same script but formatted:
r? $t0=(_KIDTENTRY64 *)0xfffff800`00124070;
.for (r $t1=0; @$t1 <= 13; r? $t0=(_KIDTENTRY64 *)@$t0+1)
{
.printf "Interrupt vector %d (0x%x):\n", @$t1, @$t1;
ln @@c++(@$t0->OffsetHigh*0x100000000 +
@$t0->OffsetMiddle*0x10000 + @$t0->OffsetLow);
r $t1=$t1+1
}
The output on my system is:
Interrupt vector 0 (0x0):
(fffff800`0103f240) nt!KiDivideErrorFault | (fffff800`0103f300) nt!KiDebugTrapOrFault
Exact matches:
nt!KiDivideErrorFault = <no type information>
Interrupt vector 1 (0×1):
(fffff800`0103f300) nt!KiDebugTrapOrFault | (fffff800`0103f440) nt!KiNmiInterrupt
Exact matches:
nt!KiDebugTrapOrFault = <no type information>
Interrupt vector 2 (0×2):
(fffff800`0103f440) nt!KiNmiInterrupt | (fffff800`0103f680) nt!KxNmiInterrupt
Exact matches:
nt!KiNmiInterrupt = <no type information>
Interrupt vector 3 (0×3):
(fffff800`0103f780) nt!KiBreakpointTrap | (fffff800`0103f840) nt!KiOverflowTrap
Exact matches:
nt!KiBreakpointTrap = <no type information>
Interrupt vector 4 (0×4):
(fffff800`0103f840) nt!KiOverflowTrap | (fffff800`0103f900) nt!KiBoundFault
Exact matches:
nt!KiOverflowTrap = <no type information>
Interrupt vector 5 (0×5):
(fffff800`0103f900) nt!KiBoundFault | (fffff800`0103f9c0) nt!KiInvalidOpcodeFault
Exact matches:
nt!KiBoundFault = <no type information>
Interrupt vector 6 (0×6):
(fffff800`0103f9c0) nt!KiInvalidOpcodeFault | (fffff800`0103fb80) nt!KiNpxNotAvailableFault
Exact matches:
nt!KiInvalidOpcodeFault = <no type information>
Interrupt vector 7 (0×7):
(fffff800`0103fb80) nt!KiNpxNotAvailableFault | (fffff800`0103fc40) nt!KiDoubleFaultAbort
Exact matches:
nt!KiNpxNotAvailableFault = <no type information>
Interrupt vector 8 (0×8):
(fffff800`0103fc40) nt!KiDoubleFaultAbort | (fffff800`0103fd00) nt!KiNpxSegmentOverrunAbort
Exact matches:
nt!KiDoubleFaultAbort = <no type information>
Interrupt vector 9 (0×9):
(fffff800`0103fd00) nt!KiNpxSegmentOverrunAbort | (fffff800`0103fdc0) nt!KiInvalidTssFault
Exact matches:
nt!KiNpxSegmentOverrunAbort = <no type information>
Interrupt vector 10 (0xa):
(fffff800`0103fdc0) nt!KiInvalidTssFault | (fffff800`0103fe80) nt!KiSegmentNotPresentFault
Exact matches:
nt!KiInvalidTssFault = <no type information>
Interrupt vector 11 (0xb):
(fffff800`0103fe80) nt!KiSegmentNotPresentFault | (fffff800`0103ff80) nt!KiStackFault
Exact matches:
nt!KiSegmentNotPresentFault = <no type information>
Interrupt vector 12 (0xc):
(fffff800`0103ff80) nt!KiStackFault | (fffff800`01040080) nt!KiGeneralProtectionFault
Exact matches:
nt!KiStackFault = <no type information>
Interrupt vector 13 (0xd):
(fffff800`01040080) nt!KiGeneralProtectionFault | (fffff800`01040180) nt!KiPageFault
Exact matches:
nt!KiGeneralProtectionFault = <no type information>
Interrupt vector 14 (0xe):
(fffff800`01040180) nt!KiPageFault | (fffff800`010404c0) nt!KiFloatingErrorFault
Exact matches:
nt!KiPageFault = <no type information>
Interrupt vector 15 (0xf):
(fffff800`01179090) nt!KxUnexpectedInterrupt0+0xf0 | (fffff800`0117a0c0) nt!KiNode0
Interrupt vector 16 (0×10):
(fffff800`010404c0) nt!KiFloatingErrorFault | (fffff800`01040600) nt!KiAlignmentFault
Exact matches:
nt!KiFloatingErrorFault = <no type information>
Interrupt vector 17 (0×11):
(fffff800`01040600) nt!KiAlignmentFault | (fffff800`010406c0) nt!KiMcheckAbort
Exact matches:
nt!KiAlignmentFault = <no type information>
Interrupt vector 18 (0×12):
(fffff800`010406c0) nt!KiMcheckAbort | (fffff800`01040900) nt!KxMcheckAbort
Exact matches:
nt!KiMcheckAbort = <no type information>
Interrupt vector 19 (0×13):
(fffff800`01040a00) nt!KiXmmException | (fffff800`01040b80) nt!KiRaiseAssertion
Exact matches:
nt!KiXmmException = <no type information>
Let’s look at some dump.
BugCheck 1E, {ffffffffc0000005, fffffade5ba2d643, 0, 28}This is KMODE_EXCEPTION_NOT_HANDLED and obviously it could have been invalid memory access. And indeed the stack WinDbg shows after opening a dump and entering !analyze -v command is:
RSP
fffffade`4e88fe68 nt!KeBugCheckEx
fffffade`4e88fe70 nt!KiDispatchException+0x128
fffffade`4e8905f0 nt!KiPageFault+0x1e1
fffffade`4e890780 driver!foo+0x9b
and the exception context is:
2: kd> r
Last set context:
rax=fffffade4e8907f4 rbx=fffffade6de0c2e0 rcx=fffffa8014412000
rdx=fffffade71e7e2ac rsi=0000000000000000 rdi=fffffadffff03000
rip=fffffade5ba2d643 rsp=fffffade4e890780 rbp=fffffade71e7ffff
r8=00000000000005b0 r9=fffffade4e890a88 r10=fffffadffd077898
r11=fffffade71e7e260 r12=0000000000000000 r13=0000000000000000
r14=0000000000000000 r15=0000000000000000
iopl=0 nv up ei pl zr na po nc
cs=0010 ss=0018 ds=0950 es=4e89 fs=fade gs=ffff efl=00010246
driver!foo+0×9b:
fffffade`5ba2d643 8b4e28 mov ecx,dword ptr [rsi+28h] ds:0950:0028=????????
We see that KiPageFault was called and from the dumped IDT we see it corresponds to the interrupt vector 14 (0xE) which is called on any memory reference that is not present in physical memory.
Now I’m going to dump the raw stack around fffffade`4e890780 to see our the values the processor saved before calling KiPageFault:
2: kd> dps fffffade`4e890780-50 fffffade`4e890780+50
fffffade`4e890730  fffffade`6de0c2e0
fffffade`4e890738  fffffadf`fff03000
fffffade`4e890740  00000000`00000000
fffffade`4e890748  fffffade`71e7ffff
fffffade`4e890750  00000000`00000000 ; ErrorCode
fffffade`4e890758  fffffade`5ba2d643 driver!foo+0×9b ; RIP
fffffade`4e890760  00000000`00000010 ; CS
fffffade`4e890768  00000000`00010246 ; RFLAGS
fffffade`4e890770  fffffade`4e890780 ; RSP
fffffade`4e890778  00000000`00000018 ; SS
fffffade`4e890780  00000000`00000000 ; RSP before interrupt
fffffade`4e890788  00000000`00000000
fffffade`4e890790  00000000`00000000
fffffade`4e890798  00000000`00000000
fffffade`4e8907a0  00000000`00000000
fffffade`4e8907a8  00000000`00000000
fffffade`4e8907b0  00000000`00000000
fffffade`4e8907b8  00000000`00000000
fffffade`4e8907c0  00000000`00000000
fffffade`4e8907c8  00000000`00000000
fffffade`4e8907d0  00000000`00000000
You see the values are exactly the same as WinDbg shows in the saved context above. Actually if you look at Page-Fault Error Code bits in Intel Architecture Software Developer’s Manual Volume 3A, you would see that for this case, all zeroes, we have:
- the page was not present in memory
- the fault was caused by the read access
- the processor was executing in kernel mode
- no reserved bits in page directory were set to 1 when 0s were expected
- it was not caused by instruction fetch
In Part 1 discussed interrupt processing that happens when an x86 processor executes in privileged protected mode (ring 0). It pushes interrupt frame shown in the following pseudo-code:
push EFLAGS

push CS

push EIP

push ErrorCode

EIP := IDT[VectorNumber].ExtendedOffset<<16 +

IDT[VectorNumber].Offset
Please note that this is an interrupt frame that is created by CPU and not a trap frame created by a software interrupt handler to save CPU state (_KTRAP_FRAME).
If an x86 processor executes in user mode (ring 3) and an interrupt happens then the stack switch occurs before the processor saves user mode stack pointer SS:ESP and pushes the rest of the interrupt frame. Pushing both SS:RSP always happens on x64 processor regardless of the current execution mode, kernel or user. Therefore the following x86 pseudo-code shows how interrupt frame is pushed on the current stack (to be precise, on the kernel space stack if the interrupt happened in user mode):
push SS

push ESP

push EFLAGS

push CS

push EIP

push ErrorCode

EIP := IDT[VectorNumber].ExtendedOffset<<16 +

IDT[VectorNumber].Offset
Usually CS is 0×1b and SS is 0×23 for x86 Windows flat memory model so we can easily identify this pattern on raw stack data.
Why should we care about an interrupt frame? This is because in complete full memory dumps we can see exceptions that happened in user space and were being processed at the time the dump was saved.
Let’s look at some example:
PROCESS 89a94800 SessionId: 1 Cid: 1050 Peb: 7ffd7000 ParentCid: 08a4
DirBase: 390f5000 ObjectTable: e36ee0b8 HandleCount: 168.
Image: processA.exe
VadRoot 8981d0a0 Vads 309 Clone 0 Private 222555. Modified 10838. Locked 0.
DeviceMap e37957e0
Token e395b8f8
ElapsedTime 07:44:38.505
UserTime 00:54:52.906
KernelTime 00:00:58.109
QuotaPoolUsage[PagedPool] 550152
QuotaPoolUsage[NonPagedPool] 14200
Working Set Sizes (now,min,max) (213200, 50, 345) (852800KB, 200KB, 1380KB)
PeakWorkingSetSize 227093
VirtualSize 1032 Mb
PeakVirtualSize 1032 Mb
PageFaultCount 232357
MemoryPriority BACKGROUND
BasePriority 8
CommitCharge 233170
DebugPort 899b6a40
We see that the process has a DebugPort and the presence of it usually shows that some exception happened. Therefore if you dump all processes by entering !process 0 1 command you can search for any unhandled exceptions.
Indeed if we switch to this process (you can also use !process 89a94800 ff command for dumps coming from XP and higher systems) we see KiDispatchException on one of the processA’s threads:
0: kd> .process 89a94800
0: kd> .reload
0: kd> !process 89a94800
...
...
...
THREAD 89a93020 Cid 1050.1054 Teb: 7ffdf000 Win32Thread: bc1da760 WAIT: (Unknown) KernelMode Non-Alertable
SuspendCount 1
f44dc3a8 SynchronizationEvent
Not impersonating
DeviceMap e37957e0
Owning Process 89a94800 Image: processA.exe
Wait Start TickCount 4244146 Ticks: 1232980 (0:05:21:05.312)
Context Switch Count 1139234 LargeStack
UserTime 00:54:51.0531
KernelTime 00:00:53.0937
Win32 Start Address processA!WinMainCRTStartup (0x00c534c8)
Start Address kernel32!BaseProcessStartThunk (0x77e617f8)
Stack Init f44dcbd0 Current f44dc2ec Base f44dd000 Limit f44d7000 Call f44dcbd8
Priority 12 BasePriority 8 PriorityDecrement 2
ChildEBP RetAddr
f44dc304 8083d5b1 nt!KiSwapContext+0x26
f44dc330 8083df9e nt!KiSwapThread+0x2e5
f44dc378 809c3cff nt!KeWaitForSingleObject+0x346
f44dc458 809c4f09 nt!DbgkpQueueMessage+0x178
f44dc47c 80977ad9 nt!DbgkpSendApiMessage+0x45
f44dc508 8081a94f nt!DbgkForwardException+0x90
f44dc8c4 808346b4 nt!KiDispatchException+0×1ea
f44dc92c 80834650 nt!CommonDispatchException+0×4a
f44dc9b8 80a801ae nt!Kei386EoiHelper+0×16e
0012f968 0046915d hal!HalpDispatchSoftwareInterrupt+0×5e
0012f998 0047cb72 processA!CalculateClientSizeFromPoint+0×5f
0012f9bc 0047cc1d processA!CalculateFromPoint+0×30
0012fa64 0047de83 processA!DrawUsingMemDC+0×1b9
0012fac0 0099fb43 processA!OnDraw+0×13
0012fb5c 7c17332d processA!OnPaint+0×56
0012fbe8 7c16e0b0 MFC71!CWnd::OnWndMsg+0×340
0012fc08 00c6253a MFC71!CWnd::WindowProc+0×22
0012fc24 0096cf9d processA!WindowProc+0×38
0012fcb8 7c16e1b8 MFC71!AfxCallWndProc+0×91
0012fcd8 7c16e1f6 MFC71!AfxWndProc+0×46
0012fd04 7739b6e3 MFC71!AfxWndProcBase+0×39
0012fd30 7739b874 USER32!InternalCallWinProc+0×28
0012fda8 7739c8b8 USER32!UserCallWinProcCheckWow+0×151
0012fe04 7739c9c6 USER32!DispatchClientMessage+0xd9
0012fe2c 7c828536 USER32!__fnDWORD+0×24
0012fe2c 80832dee ntdll!KiUserCallbackDispatcher+0×2e
f44dcbf0 8092d605 nt!KiCallUserMode+0×4
f44dcc48 bf8a26d3 nt!KeUserModeCallback+0×8f
f44dcccc bf89e985 win32k!SfnDWORD+0xb4
f44dcd0c bf89eb27 win32k!xxxDispatchMessage+0×223
f44dcd58 80833bdf win32k!NtUserDispatchMessage+0×4c
f44dcd58 7c8285ec nt!KiFastCallEntry+0xfc
0012fe2c 7c828536 ntdll!KiFastSystemCallRet
0012fe58 7739c57b ntdll!KiUserCallbackDispatcher+0×2e
0012fea8 773a16e5 USER32!NtUserDispatchMessage+0xc
0012feb8 7c169076 USER32!DispatchMessageA+0xf
0012fec8 7c16913e MFC71!AfxInternalPumpMessage+0×3e
0012fee4 0041cb0b MFC71!CWinThread::Run+0×54
0012ff08 7c172fc5 processA!CMain::Run+0×3b
0012ff18 00c5364d MFC71!AfxWinMain+0×68
0012ffc0 77e6f23b processA!WinMainCRTStartup+0×185
0012fff0 00000000 kernel32!BaseProcessStart+0×23
You might think that exception happened in CalculateClientSizeFromPoint function. However there is no nt!KiTrapXXX call and hal!HalpDispatchSoftwareInterrupt has user space return address and this looks suspicious. So we need to look at raw stack data and find our interrupt frame. We look for KiDispatchException, then for KiTrap substring and finally for 0000001b. If 0000001b and 00000023 are separated by 2 double words then we have found out interrupt frame:
0: kd> .thread 89a93020
Implicit thread is now 89a93020
0: kd> dds esp esp+1000
...
...
...
f44dc2f8 f44dc330
f44dc2fc 89a93098
f44dc300 ffdff120
f44dc304 89a93020
f44dc308 8083d5b1 nt!KiSwapThread+0x2e5
f44dc30c 89a93020
f44dc310 89a930c8
f44dc314 00000000
...
...
...
f44dc4e8 f44dcc38
f44dc4ec 8083a8cc nt!_except_handler3
f44dc4f0 80870868 nt!`string'+0xa4
f44dc4f4 ffffffff
f44dc4f8 80998bfd nt!Ki386CheckDivideByZeroTrap+0x273
f44dc4fc 8083484f nt!KiTrap00+0x88
f44dc500 00000001
f44dc504 0000bb40
f44dc508 f44dc8c4
f44dc50c 8081a94f nt!KiDispatchException+0×1ea
f44dc510 f44dc8e0
f44dc514 00000001
f44dc518 00000000
f44dc51c 00469583 processA!LPtoDP+0×19
f44dc520 16b748f0
f44dc524 00469583 processA!LPtoDP+0×19
f44dc528 00000000
f44dc52c 00000000
…
…
…
f44dc8c0 ffffffff
f44dc8c4 f44dc934
f44dc8c8 808346b4 nt!CommonDispatchException+0×4a
f44dc8cc f44dc8e0
f44dc8d0 00000000
f44dc8d4 f44dc934
f44dc8d8 00000001
f44dc8dc 00000001
f44dc8e0 c0000094
f44dc8e4 00000000
f44dc8e8 00000000
f44dc8ec 00469583 processA!LPtoDP+0×19
f44dc8f0 00000000
f44dc8f4 808a3988 nt!KiAbiosPresent+0×4
f44dc8f8 ffffffff
f44dc8fc 0000a6f2
f44dc900 00469585 processA!LPtoDP+0×1b
f44dc904 00000004
f44dc908 00000000
f44dc90c f9000001
f44dc910 f44dc8dc
f44dc914 ffffffff
f44dc918 f44dcc38
f44dc91c 8083a8cc nt!_except_handler3
f44dc920 80870868 nt!`string’+0xa4
f44dc924 ffffffff
f44dc928 80998bfd nt!Ki386CheckDivideByZeroTrap+0×273
f44dc92c 8083484f nt!KiTrap00+0×88
f44dc930 80834650 nt!Kei386EoiHelper+0×16e
f44dc934 0012f968
f44dc938 00469583 processA!LPtoDP+0×19
f44dc93c badb0d00
f44dc940 00000000
f44dc944 ffffffff
f44dc948 00007fff
f44dc94c 00000000
f44dc950 fffff800
f44dc954 ffffffff
f44dc958 00007fff
f44dc95c 00000000
f44dc960 00000000
f44dc964 80a80000 hal!HalpInitIrqlAuditFlag+0×4e
f44dc968 00000023
f44dc96c 00000023
f44dc970 00000000
f44dc974 00000000
f44dc978 00005334
f44dc97c 00000001
f44dc980 f44dcc38
f44dc984 0000003b
f44dc988 16b748f0
f44dc98c 16b748f0
f44dc990 0012f9fc
f44dc994 0012f968
f44dc998 00000000 ; ErrorCode
f44dc99c 00469583 processA!LPtoDP+0×19 ; EIP
f44dc9a0 0000001b ; CS
f44dc9a4 00010246 ; EFLAGS
f44dc9a8 0012f934 ; ESP
f44dc9ac 00000023 ; SS
f44dc9b0 8982e7e0
f44dc9b4 00000000
Why did we skip the first KiTrap00? Because KiDispatchException is called after KiTrap00 so we should see it before KiTrap00 on raw stack. To see all these calls we can disassemble return addresses:
0: kd> .asm no_code_bytes
Assembly options: no_code_bytes
0: kd> ub nt!KiTrap00+0x88
nt!KiTrap00+0x74:
8083483b test byte ptr [ebp+6Ch],1
8083483f je   nt!KiTrap00+0x81 (80834848)
80834841 cmp  word ptr [ebp+6Ch],1Bh
80834846 jne  nt!KiTrap00+0x9e (80834865)
80834848 sti
80834849 push ebp
8083484a call nt!Ki386CheckDivideByZeroTrap (8099897d)
8083484f mov  ebx,dword ptr [ebp+68h]
nt!KiTrap00+0×88 is not equal to nt!KiTrap00+0×74 so we have OMAP code optimization case here and we have to disassemble raw addresses as seen on the raw stack fragment repeated here:
...
...
...
f44dc8c8 808346b4 nt!CommonDispatchException+0x4a
...
...
...
f44dc924 ffffffff
f44dc928 80998bfd nt!Ki386CheckDivideByZeroTrap+0x273
f44dc92c 8083484f nt!KiTrap00+0×88
f44dc930 80834650 nt!Kei386EoiHelper+0×16e
f44dc934 0012f968
…
…
…
0: kd> u 8083484f
nt!KiTrap00+0×88:
8083484f mov ebx,dword ptr [ebp+68h]
80834852 jmp nt!Kei386EoiHelper+0×167 (80834649)
80834857 sti
80834858 mov ebx,dword ptr [ebp+68h]
8083485b mov eax,0C0000094h
80834860 jmp nt!Kei386EoiHelper+0×167 (80834649)
80834865 mov ebx,dword ptr fs:[124h]
8083486c mov ebx,dword ptr [ebx+38h]
0: kd> u 80834649
nt!Kei386EoiHelper+0×167:
80834649 xor ecx,ecx
8083464b call nt!CommonDispatchException (8083466a)
80834650 xor edx,edx ; nt!Kei386EoiHelper+0×16e
80834652 mov ecx,1
80834657 call nt!CommonDispatchException (8083466a)
8083465c xor edx,edx
8083465e mov ecx,2
80834663 call nt!CommonDispatchException (8083466a)
0: kd> ub 808346b4
nt!CommonDispatchException+0×38:
808346a2 mov eax,dword ptr [ebp+6Ch]
808346a5 and eax,1
808346a8 push 1
808346aa push eax
808346ab push ebp
808346ac push 0
808346ae push ecx
808346af call nt!KiDispatchException (80852a53)So we see that KiTrap00 calls CommonDispatchException which calls KiDispatchException. If we look at our found interrupt frame we see that EIP of the exception was 00469583 and ESP was 0012f934:
...
...
...
f44dc998 00000000 ; ErrorCode
f44dc99c 00469583 processA!LPtoDP+0×19 ; EIP
f44dc9a0 0000001b ; CS
f44dc9a4 00010246 ; EFLAGS
f44dc9a8 0012f934 ; ESP
f44dc9ac 00000023 ; SS
…
…
…
Now we try to reconstruct stack trace by putting the values of ESP and EIP:
0: kd> k L=0012f934 0012f934 00469583 ; EBP ESP EIP format
ChildEBP RetAddr
0012f930 00469a16 processA!LPtoDP+0x19
0012f934 00000000 processA!GetColumnWidth+0x45
Stack trace doesn’t look good, there is neither BaseProcessStart nor BaseThreadStart, perhaps because we specified ESP value twice instead of EBP and ESP. Let’s hope to find EBP value by dumping the memory around ESP:
0: kd> dds 0012f934-10 0012f934+100
0012f924 00000000
0012f928 0012f934 ; the same as ESP
0012f92c 0012f968 ; looks good to us
0012f930 00469572 processA!LPtoDP+0×8
0012f934 00469a16 processA!GetColumnWidth+0×45
0012f938 00005334
…
…
…
0012f964 00005334
0012f968 0012f998
0012f96c 0046915d processA!CalculateClientSizeFromPoint+0×5f
0012f970 00000000
0012f974 0012f9fc
0012f978 16b748f0
0012f97c 0012fa48
0012f980 00000000
0012f984 00000000
0012f988 000003a0
0012f98c 00000237
0012f990 00000014
0012f994 00000000
0012f998 0012f9bc
0012f99c 0047cb72 processA!CalculateFromPoint+0×30
0012f9a0 0012f9fc
0012f9a4 0012f9b4
0012f9a8 0012fa48
…
…
…
So finally we get our stack trace:
0: kd> k L=0012f968 0012f934 00469583 100
ChildEBP RetAddr
0012f930 00469a16 processA!LPtoDP+0x19
0012f968 0046915d processA!GetColumnWidth+0x45
0012f998 0047cb72 processA!CalculateClientSizeFromPoint+0x5f
0012f9bc 0047cc1d processA!CalculateFromPoint+0x30
0012fa64 0047de83 processA!DrawUsingMemDC+0x1b9
0012fac0 0099fb43 processA!OnDraw+0x13
0012fb5c 7c17332d processA!OnPaint+0x56
0012fbe8 7c16e0b0 MFC71!CWnd::OnWndMsg+0x340
0012fc08 00c6253a MFC71!CWnd::WindowProc+0x22
0012fc24 0096cf9d processA!WindowProc+0x38
0012fcb8 7c16e1b8 MFC71!AfxCallWndProc+0x91
0012fcd8 7c16e1f6 MFC71!AfxWndProc+0x46
0012fd04 7739b6e3 MFC71!AfxWndProcBase+0x39
0012fd30 7739b874 USER32!InternalCallWinProc+0x28
0012fda8 7739c8b8 USER32!UserCallWinProcCheckWow+0x151
0012fe04 7739c9c6 USER32!DispatchClientMessage+0xd9
0012fe2c 7c828536 USER32!__fnDWORD+0x24
0012fe2c 80832dee ntdll!KiUserCallbackDispatcher+0x2e
f44dcbf0 8092d605 nt!KiCallUserMode+0x4
f44dcc48 bf8a26d3 nt!KeUserModeCallback+0x8f
f44dcccc bf89e985 win32k!SfnDWORD+0xb4
f44dcd0c bf89eb27 win32k!xxxDispatchMessage+0x223
f44dcd58 80833bdf win32k!NtUserDispatchMessage+0x4c
f44dcd58 7c8285ec nt!KiFastCallEntry+0xfc
0012fe2c 7c828536 ntdll!KiFastSystemCallRet
0012fe58 7739c57b ntdll!KiUserCallbackDispatcher+0x2e
0012fea8 773a16e5 USER32!NtUserDispatchMessage+0xc
0012feb8 7c169076 USER32!DispatchMessageA+0xf
0012fec8 7c16913e MFC71!AfxInternalPumpMessage+0x3e
0012fee4 0041cb0b MFC71!CWinThread::Run+0x54
0012ff08 7c172fc5 processA!CMain::Run+0x3b
0012ff18 00c5364d MFC71!AfxWinMain+0x68
0012ffc0 77e6f23b processA!WinMainCRTStartup+0x185
0012fff0 00000000 kernel32!BaseProcessStart+0x23
The previous part discussed processor interrupts in user mode. In this part I will explain WinDbg .trap command and show how to simulate it manually.
Upon an interrupt a processor saves the current instruction pointer and transfers execution to an interrupt handler as explained in the first part of these series. This interrupt handler has to save a full thread context before calling other functions to do complex interrupt processing. For example, if we disassemble KiTrap0E handler from x86 Windows 2003 crash dump we would see that it saves a lot of registers including segment registers:
3: kd> uf nt!KiTrap0E
...
...
...
nt!KiTrap0E:
e088bb2c mov     word ptr [esp+2],0
e088bb33 push    ebp
e088bb34 push    ebx
e088bb35 push    esi
e088bb36 push    edi
e088bb37 push    fs
e088bb39 mov     ebx,30h
e088bb3e mov     fs,bx
e088bb41 mov     ebx,dword ptr fs:[0]
e088bb48 push    ebx
e088bb49 sub     esp,4
e088bb4c push    eax
e088bb4d push    ecx
e088bb4e push    edx
e088bb4f push    ds
e088bb50 push    es
e088bb51 push    gs
e088bb53 mov     ax,23h
e088bb57 sub     esp,30h
e088bb5a mov     ds,ax
e088bb5d mov     es,ax
e088bb60 mov     ebp,esp
e088bb62 test    dword ptr [esp+70h],20000h
e088bb6a jne     nt!V86_kite_a (e088bb04)
...
...
...
The saved processor state information (context) forms the so called Windows kernel trap frame:
3: kd> dt _KTRAP_FRAME
+0x000 DbgEbp           : Uint4B
+0x004 DbgEip           : Uint4B
+0x008 DbgArgMark       : Uint4B
+0x00c DbgArgPointer    : Uint4B
+0x010 TempSegCs        : Uint4B
+0x014 TempEsp          : Uint4B
+0x018 Dr0              : Uint4B
+0x01c Dr1              : Uint4B
+0x020 Dr2              : Uint4B
+0x024 Dr3              : Uint4B
+0x028 Dr6              : Uint4B
+0x02c Dr7              : Uint4B
+0x030 SegGs            : Uint4B
+0x034 SegEs            : Uint4B
+0x038 SegDs            : Uint4B
+0x03c Edx              : Uint4B
+0x040 Ecx              : Uint4B
+0x044 Eax              : Uint4B
+0x048 PreviousPreviousMode : Uint4B
+0x04c ExceptionList    : Ptr32 _EXCEPTION_REGISTRATION_RECORD
+0x050 SegFs            : Uint4B
+0x054 Edi              : Uint4B
+0x058 Esi              : Uint4B
+0x05c Ebx              : Uint4B
+0x060 Ebp              : Uint4B
+0x064 ErrCode          : Uint4B
+0x068 Eip              : Uint4B
+0x06c SegCs            : Uint4B
+0x070 EFlags           : Uint4B
+0x074 HardwareEsp      : Uint4B
+0x078 HardwareSegSs    : Uint4B
+0x07c V86Es            : Uint4B
+0x080 V86Ds            : Uint4B
+0x084 V86Fs            : Uint4B
+0x088 V86Gs            : Uint4B
This Windows trap frame is not the same as an interrupt frame a processor saves on a current thread stack when an interrupt occurs in kernel mode. The latter frame is very small and consists only of EIP, CS, EFLAGS and ErrorCode. When an interrupt occurs in user mode an x86 processor additionally saves the current stack pointer SS:ESP.
The .trap command finds the trap frame on a current thread stack and sets the current thread register context using the values from that saved structure. You can see that command in action for certain bugchecks when you use !analyze -v:
3: kd> !analyze -v
KERNEL_MODE_EXCEPTION_NOT_HANDLED (8e)
...
...
...
Arguments:
Arg1: c0000005, The exception code that was not handled
Arg2: de65190c, The address that the exception occurred at
Arg3: f24f8a74, Trap Frame
Arg4: 00000000
…
…
…
TRAP_FRAME:  f24f8a74 — (.trap fffffffff24f8a74)
.trap fffffffff24f8a74
ErrCode = 00000000
eax=dbc128c0 ebx=dbe4a010 ecx=f24f8ac4 edx=00000001 esi=46525356 edi=00000000
eip=de65190c esp=f24f8ae8 ebp=f24f8b18 iopl=0 nv up ei pl nz na pe nc
cs=0008 ss=0010 ds=0023 es=0023 fs=0030 gs=0000 efl=00010206
driver!foo+0×16:
de65190c 837e1c00         cmp     dword ptr [esi+1Ch],0 ds:0023:46525372=????????
…
…
…
If we look at the trap frame we would see the same register values that WinDbg reports above:
3: kd> dt _KTRAP_FRAME f24f8a74
+0x000 DbgEbp           : 0xf24f8b18
+0x004 DbgEip           : 0xde65190c
+0x008 DbgArgMark       : 0xbadb0d00
+0x00c DbgArgPointer    : 1
+0x010 TempSegCs        : 0xb0501cd
+0x014 TempEsp          : 0xdcc01cd0
+0x018 Dr0              : 0xf24f8aa8
+0x01c Dr1              : 0xde46c90a
+0x020 Dr2              : 0
+0x024 Dr3              : 0
+0x028 Dr6              : 0xdbe4a000
+0x02c Dr7              : 0
+0x030 SegGs            : 0
+0x034 SegEs            : 0x23
+0x038 SegDs            : 0x23
+0x03c Edx              : 1
+0x040 Ecx              : 0xf24f8ac4
+0x044 Eax              : 0xdbc128c0
+0x048 PreviousPreviousMode : 0xdbe4a010
+0x04c ExceptionList    : 0xffffffff _EXCEPTION_REGISTRATION_RECORD
+0x050 SegFs            : 0x30
+0x054 Edi              : 0
+0x058 Esi              : 0x46525356
+0x05c Ebx              : 0xdbe4a010
+0x060 Ebp              : 0xf24f8b18
+0x064 ErrCode          : 0
+0x068 Eip              : 0xde65190c ; driver!foo+0x16
+0x06c SegCs            : 8
+0x070 EFlags           : 0x10206
+0x074 HardwareEsp      : 0xdbc171b0
+0x078 HardwareSegSs    : 0xde667677
+0x07c V86Es            : 0xdbc128c0
+0x080 V86Ds            : 0xdbc171c4
+0x084 V86Fs            : 0xf24f8bc4
+0x088 V86Gs            : 0
It is good to know how to find a trap frame manually in the case the stack is corrupt or WinDbg cannot find a trap frame automatically. In this case we can take the advantage of the fact that DS and ES segment registers have the same value in the Windows flat memory model:
   +0x034 SegEs            : 0x23
+0x038 SegDs            : 0x23
We need to find 2 consecutive 0×23 values on the stack. There may be several such places but usually the correct one comes between KiTrapXX address on the stack and the initial processor trap frame shown below in red. This is because KiTrapXX obviously calls other functions to further process an interrupt so its return address is saved on the stack.
3: kd> r
eax=f535713c ebx=de65190c ecx=00000000 edx=e088e1d2 esi=f5357120 edi=00000000
eip=e0827451 esp=f24f8628 ebp=f24f8640 iopl=0 nv up ei ng nz na pe nc
cs=0008 ss=0010 ds=0023 es=0023 fs=0030 gs=0000 efl=00000286
nt!KeBugCheckEx+0×1b:
e0827451 5d              pop     ebp
3: kd> dds f24f8628 f24f8628+1000
...
...
...
f24f8784 de4b2995 win32k!NtUserQueryWindow
f24f8788 00000000
f24f878c fe76a324
f24f8790 f24f8d64
f24f8794 0006e43c
f24f8798 e087c041 nt!ExReleaseResourceAndLeaveCriticalRegion+0x5
f24f879c 83f3b801
f24f87a0 f24f8a58
f24f87a4 0000003b
f24f87a8 00000000
f24f87ac 00000030
f24f87b0 00000023
f24f87b4 00000023
f24f87b8 00000000
…
…
…
f24f8a58 00000111
f24f8a5c f24f8a74
f24f8a60 e088bc08 nt!KiTrap0E+0xdc
f24f8a64 00000000
f24f8a68 46525372
f24f8a6c 00000000
f24f8a70 e0889686 nt!Kei386EoiHelper+0×186
f24f8a74 f24f8b18
f24f8a78 de65190c driver!foo+0×16
f24f8a7c badb0d00
f24f8a80 00000001
f24f8a84 0b0501cd
f24f8a88 dcc01cd0
f24f8a8c f24f8aa8
f24f8a90 de46c90a win32k!HANDLELOCK::vLockHandle+0×80
f24f8a94 00000000
f24f8a98 00000000
f24f8a9c dbe4a000
f24f8aa0 00000000
f24f8aa4 00000000
f24f8aa8 00000023
f24f8aac 00000023
f24f8ab0 00000001
f24f8ab4 f24f8ac4
f24f8ab8 dbc128c0
f24f8abc dbe4a010
f24f8ac0 ffffffff
f24f8ac4 00000030
f24f8ac8 00000000
f24f8acc 46525356
f24f8ad0 dbe4a010
f24f8ad4 f24f8b18
f24f8ad8 00000000
f24f8adc de65190c driver!foo+0×16
f24f8ae0 00000008
f24f8ae4 00010206
f24f8ae8 dbc171b0
f24f8aec de667677 driver!bar+0×173
f24f8af0 dbc128c0
f24f8af4 dbc171c4
f24f8af8 f24f8bc4
f24f8afc 00000000
…
…
…Subtracting the offset 0×38 from the address of the 00000023 value (f24f8aac) and using dt command we can check _KTRAP_FRAME structure and apply .trap command afterwards:
3: kd> dt _KTRAP_FRAME f24f8aac-38
+0x000 DbgEbp           : 0xf24f8b18
+0x004 DbgEip           : 0xde65190c
+0x008 DbgArgMark       : 0xbadb0d00
+0x00c DbgArgPointer    : 1
+0x010 TempSegCs        : 0xb0501cd
+0x014 TempEsp          : 0xdcc01cd0
+0x018 Dr0              : 0xf24f8aa8
+0x01c Dr1              : 0xde46c90a
+0x020 Dr2              : 0
+0x024 Dr3              : 0
+0x028 Dr6              : 0xdbe4a000
+0x02c Dr7              : 0
+0x030 SegGs            : 0
+0x034 SegEs            : 0x23
+0x038 SegDs            : 0x23
+0x03c Edx              : 1
+0x040 Ecx              : 0xf24f8ac4
+0x044 Eax              : 0xdbc128c0
+0x048 PreviousPreviousMode : 0xdbe4a010
+0x04c ExceptionList    : 0xffffffff _EXCEPTION_REGISTRATION_RECORD
+0x050 SegFs            : 0x30
+0x054 Edi              : 0
+0x058 Esi              : 0x46525356
+0x05c Ebx              : 0xdbe4a010
+0x060 Ebp              : 0xf24f8b18
+0x064 ErrCode          : 0
+0x068 Eip              : 0xde65190c
+0x06c SegCs            : 8
+0x070 EFlags           : 0x10206
+0x074 HardwareEsp      : 0xdbc171b0
+0x078 HardwareSegSs    : 0xde667677
+0x07c V86Es            : 0xdbc128c0
+0x080 V86Ds            : 0xdbc171c4
+0x084 V86Fs            : 0xf24f8bc4
+0x088 V86Gs            : 0
3: kd> ? f24f8aac-38
Evaluate expression: -229668236 = f24f8a743: kd> .trap f24f8a74
ErrCode = 00000000
eax=dbc128c0 ebx=dbe4a010 ecx=f24f8ac4 edx=00000001 esi=46525356 edi=00000000
eip=de65190c esp=f24f8ae8 ebp=f24f8b18 iopl=0 nv up ei pl nz na pe nc
cs=0008 ss=0010 ds=0023 es=0023 fs=0030 gs=0000 efl=00010206
driver!foo+0x16:
de65190c 837e1c00 cmp dword ptr [esi+1Ch],0 ds:0023:46525372=????????In complete memory dumps we can see that _KTRAP_FRAME is saved when calling system services too:
3: kd> kL
ChildEBP RetAddr
f24f8ae8 de667677 driver!foo+0x16
f24f8b18 de667799 driver!bar+0x173
f24f8b90 de4a853e win32k!GreSaveScreenBits+0x69
f24f8bd8 de4922bd win32k!CreateSpb+0x167
f24f8c40 de490bb8 win32k!zzzChangeStates+0x448
f24f8c88 de4912de win32k!zzzBltValidBits+0xe2
f24f8ce0 de4926c6 win32k!xxxEndDeferWindowPosEx+0x13a
f24f8cfc de49aa8f win32k!xxxSetWindowPos+0xb1
f24f8d34 de4acf4d win32k!xxxShowWindow+0x201
f24f8d54 e0888c6c win32k!NtUserShowWindow+0x79
f24f8d54 7c94ed54 nt!KiFastCallEntry+0xfc (TrapFrame @ f24f8d64)
0006e48c 77e34f1d ntdll!KiFastSystemCallRet
0006e53c 77e2f12f USER32!NtUserShowWindow+0xc
0006e570 77e2b0fe USER32!InternalDialogBox+0xa9
0006e590 77e29005 USER32!DialogBoxIndirectParamAorW+0×37
0006e5b4 0103d569 USER32!DialogBoxParamW+0×3f
0006e5d8 0102d2f5 winlogon!Fusion_DialogBoxParam+0×24
and we can get the current thread context before its transition to kernel mode:
3: kd> .trap f24f8d64
ErrCode = 00000000
eax=7ffff000 ebx=00000000 ecx=00000000 edx=7c94ed54 esi=00532e68 edi=0002002c
eip=7c94ed54 esp=0006e490 ebp=0006e53c iopl=0 nv up ei pl zr na pe nc
cs=001b ss=0023 ds=0023 es=0023 fs=003b gs=0000 efl=00000246
ntdll!KiFastSystemCallRet:
001b:7c94ed54 c3              ret
3: kd> kL
ChildEBP RetAddr
0006e48c 77e34f1d ntdll!KiFastSystemCallRet
0006e53c 77e2f12f USER32!NtUserShowWindow+0xc
0006e570 77e2b0fe USER32!InternalDialogBox+0xa9
0006e590 77e29005 USER32!DialogBoxIndirectParamAorW+0x37
0006e5b4 0103d569 USER32!DialogBoxParamW+0x3f
0006e5d8 0102d2f5 winlogon!Fusion_DialogBoxParam+0x24In this part I’ll show how to simulate .trap WinDbg command when you have x64 Windows kernel and complete memory dumps.
When you have a fault an x64 processor saves some registers on the current thread stack as explained previously in Part 2. Then an interrupt handler saves _KTRAP_FRAME on the stack:
6: kd> uf nt!KiPageFault
nt!KiPageFault:
fffff800`0102d400 push    rbp
fffff800`0102d401 sub     rsp,158h
fffff800`0102d408 lea     rbp,[rsp+80h]
fffff800`0102d410 mov     byte ptr [rbp-55h],1
fffff800`0102d414 mov     qword ptr [rbp-50h],rax
fffff800`0102d418 mov     qword ptr [rbp-48h],rcx
fffff800`0102d41c mov     qword ptr [rbp-40h],rdx
fffff800`0102d420 mov     qword ptr [rbp-38h],r8
fffff800`0102d424 mov     qword ptr [rbp-30h],r9
fffff800`0102d428 mov     qword ptr [rbp-28h],r10
fffff800`0102d42c mov     qword ptr [rbp-20h],r11
...
...
...
6: kd> dt _KTRAP_FRAME
+0x000 P1Home : Uint8B
+0x008 P2Home : Uint8B
+0x010 P3Home : Uint8B
+0x018 P4Home : Uint8B
+0x020 P5 : Uint8B
+0x028 PreviousMode : Char
+0x029 PreviousIrql : UChar
+0x02a FaultIndicator : UChar
+0x02b ExceptionActive : UChar
+0x02c MxCsr : Uint4B
+0x030 Rax : Uint8B
+0x038 Rcx : Uint8B
+0x040 Rdx : Uint8B
+0x048 R8 : Uint8B
+0x050 R9 : Uint8B
+0x058 R10 : Uint8B
+0x060 R11 : Uint8B
+0x068 GsBase : Uint8B
+0x068 GsSwap : Uint8B
+0x070 Xmm0 : _M128A
+0x080 Xmm1 : _M128A
+0x090 Xmm2 : _M128A
+0x0a0 Xmm3 : _M128A
+0x0b0 Xmm4 : _M128A
+0x0c0 Xmm5 : _M128A
+0x0d0 FaultAddress : Uint8B
+0x0d0 ContextRecord : Uint8B
+0x0d0 TimeStamp : Uint8B
+0x0d8 Dr0 : Uint8B
+0x0e0 Dr1 : Uint8B
+0x0e8 Dr2 : Uint8B
+0x0f0 Dr3 : Uint8B
+0x0f8 Dr6 : Uint8B
+0x100 Dr7 : Uint8B
+0x108 DebugControl : Uint8B
+0x110 LastBranchToRip : Uint8B
+0x118 LastBranchFromRip : Uint8B
+0x120 LastExceptionToRip : Uint8B
+0x128 LastExceptionFromRip : Uint8B
+0x108 LastBranchControl : Uint8B
+0x110 LastBranchMSR : Uint4B
+0x130 SegDs : Uint2B
+0x132 SegEs : Uint2B
+0x134 SegFs : Uint2B
+0x136 SegGs : Uint2B
+0x138 TrapFrame : Uint8B
+0x140 Rbx : Uint8B
+0x148 Rdi : Uint8B
+0x150 Rsi : Uint8B
+0x158 Rbp : Uint8B
+0×160 ErrorCode : Uint8B
+0×160 ExceptionFrame : Uint8B
+0×168 Rip : Uint8B
+0×170 SegCs : Uint2B
+0×172 Fill1 : [3] Uint2B
+0×178 EFlags : Uint4B
+0×17c Fill2 : Uint4B
+0×180 Rsp : Uint8B
+0×188 SegSs : Uint2B
+0×18a Fill3 : [1] Uint2B
+0×18c CodePatchCycle : Int4BUnfortunately the technique to use DS and ES pair to find the trap frame in x86 Windows crash dump doesn’t work here because KiPageFault interrupt handler doesn’t save them as can be found by inspecting its disassembly. Fortunately the registers that an x64 processor pushes upon an interrupt are part of _KTRAP_FRAME shown in blue above. Fill1, Fill2, Fill3 and CodePatchCycle are just dummy values to fill 64-bit slots because CS and SS are 16-bit registers and in 64-bit RFLAGS only the first 32-bit EFLAGS part is currently used. Remember that a processor in 64-bit mode pushes 64-bit values even if values occupy only 16 or 32-bit. Therefore we can try to find CS and SS on the stack because they have the following constant values:
6: kd> r cs
cs=0010
6: kd> r ss
ss=0018
6: kd> k
Child-SP RetAddr Call Site
fffffadc`6e02b9e8 fffff800`013731b1 nt!KeBugCheckEx
…
…
…
fffffadc`6e02cd70 fffff800`010202d6 nt!PspSystemThreadStartup+0×3e
fffffadc`6e02cdd0 00000000`00000000 nt!KxStartSystemThread+0×166: kd> dqs fffffadc`6e02b9e8 fffffadc`6e02cd70
...
...
...
fffffadc`6e02c938 fffff800`0102d5e1 nt!KiPageFault+0x1e1
...
...
...
fffffadc`6e02ca70 fffff97f`f3937a8c
fffffadc`6e02ca78 fffff97f`ff57d28b driver+0x3028b
fffffadc`6e02ca80 00000000`00000000
fffffadc`6e02ca88 fffff97f`f3937030
fffffadc`6e02ca90 fffff97f`ff5c2990 driver+0x75990
fffffadc`6e02ca98 00000000`00000000
fffffadc`6e02caa0 00000000`00000000 ; ErrorCode
fffffadc`6e02caa8 fffff97f`ff591ed3 driver+0x44ed3 ; RIP
fffffadc`6e02cab0 00000000`00000010 ; CS
fffffadc`6e02cab8 00000000`00010282 ; RFLAGS
fffffadc`6e02cac0 fffffadc`6e02cad0 ; RSP
fffffadc`6e02cac8 00000000`00000018 ; SS
fffffadc`6e02cad0 fffff97f`f382b0e0
fffffadc`6e02cad8 fffffadc`6e02cbd0
fffffadc`6e02cae0 fffff97f`f3937a8c
fffffadc`6e02cae8 fffff97f`f3937030
fffffadc`6e02caf0 00000000`00000000
fffffadc`6e02caf8 00000000`00000001
…
…
…Now we can calculate the trap frame address by subtracting SegSs offset in _KTRAP_FRAME structure (0×188) from fffffadc`6e02cac8 address:
6: kd> ? fffffadc`6e02cac8-188
Evaluate expression: -5650331285184 = fffffadc`6e02c940
6: kd> .trap fffffadc`6e02c940
NOTE: The trap frame does not contain all registers.
Some register values may be zeroed.
rax=fffffadcdac27298 rbx=0000000000000000 rcx=fffffadcdb45a4c0
rdx=0000000000000555 rsi=fffff97fff5c2990 rdi=fffff97ff3937030
rip=fffff97fff591ed3 rsp=fffffadc6e02cad0 rbp=0000000000000000
r8=fffffadcdac27250 r9=fffff97ff3824030 r10=0000000000000020
r11=fffffadcdac27250 r12=0000000000000000 r13=0000000000000000
r14=0000000000000000 r15=0000000000000000
iopl=0 nv up ei ng nz na pe nc
driver+0x44ed3:
fffff97f`ff591ed3 0fb74514 movzx eax,word ptr [rbp+14h] ss:0018:00000000`00000014=????6: kd> k
Child-SP RetAddr Call Site
fffffadc`6e02cad0 fffff97f`ff5935f7 driver+0x44ed3
fffffadc`6e02cc40 fffff800`0124b972 driver+0x465f7
fffffadc`6e02cd70 fffff800`010202d6 nt!PspSystemThreadStartup+0x3e
fffffadc`6e02cdd0 00000000`00000000 nt!KxStartSystemThread+0x16Our example shows how to find a trap frame manually in x64 kernel or complete memory dump. Usually WinDbg finds trap frames automatically (call arguments are removed from the verbose stack trace for clarity):
6: kd> kv
Child-SP          RetAddr           Call Site
fffffadc`6e02b9e8 fffff800`013731b1 nt!KeBugCheckEx
fffffadc`6e02b9f0 fffff800`010556ab nt!PspSystemThreadStartup+0x270
fffffadc`6e02ba40 fffff800`010549fd nt!_C_specific_handler+0x9b
fffffadc`6e02bad0 fffff800`01054f93 nt!RtlpExecuteHandlerForException+0xd
fffffadc`6e02bb00 fffff800`0100b901 nt!RtlDispatchException+0x2c0
fffffadc`6e02c1c0 fffff800`0102e76f nt!KiDispatchException+0xd9
fffffadc`6e02c7c0 fffff800`0102d5e1 nt!KiExceptionExit
fffffadc`6e02c940 fffff97f`ff591ed3 nt!KiPageFault+0x1e1 (TrapFrame @ fffffadc`6e02c940)
fffffadc`6e02cad0 fffff97f`ff5935f7 driver+0×44ed3
fffffadc`6e02cc40 fffff800`0124b972 driver+0×465f7
fffffadc`6e02cd70 fffff800`010202d6 nt!PspSystemThreadStartup+0×3e
fffffadc`6e02cdd0 00000000`00000000 nt!KxStartSystemThread+0×16
Previous parts were dealing with exceptions in kernel mode. In this and next parts I’m going to investigate the flow of exception processing in user mode. In part 1 I mentioned that interrupts and exceptions generated when CPU executes code in user mode require a processor to switch the current user mode stack to kernel mode stack. This can be seen when we have a user debugger attached and it gets an exception notification called first chance exception. Because of the stack switch we don’t see any saved processor context on user mode thread stack when WinDbg breaks on first-chance exception in TestDefaultDebugger64:
0:000> r
rax=0000000000000000 rbx=0000000000000001 rcx=000000000012fd80
rdx=00000000000003e8 rsi=000000000012fd80 rdi=0000000140033fe0
rip=0000000140001690 rsp=000000000012f198 rbp=0000000000000111
r8=0000000000000000  r9=0000000140001690 r10=0000000140001690
r11=000000000012f260 r12=0000000000000000 r13=00000000000003e8
r14=0000000000000110 r15=0000000000000001
iopl=0         nv up ei pl zr na po nc
cs=0033  ss=002b  ds=002b  es=002b  fs=0053  gs=002b             efl=00010246
TestDefaultDebugger64!CTestDefaultDebuggerDlg::OnBnClickedButton1:
00000001`40001690 c704250000000000000000 mov dword ptr [0],0 ds:00000000`00000000=????????
0:000> kL 100
Child-SP RetAddr Call Site
00000000`0012f198 00000001`40004ba0 TestDefaultDebugger64!CTestDefaultDebuggerDlg::OnBnClickedButton1
00000000`0012f1a0 00000001`40004de0 TestDefaultDebugger64!_AfxDispatchCmdMsg+0xc4
00000000`0012f1d0 00000001`4000564e TestDefaultDebugger64!CCmdTarget::OnCmdMsg+0x180
00000000`0012f230 00000001`4000c6b4 TestDefaultDebugger64!CDialog::OnCmdMsg+0x32
00000000`0012f270 00000001`4000d4d8 TestDefaultDebugger64!CWnd::OnCommand+0xcc
00000000`0012f300 00000001`400082e0 TestDefaultDebugger64!CWnd::OnWndMsg+0x60
00000000`0012f440 00000001`4000b77a TestDefaultDebugger64!CWnd::WindowProc+0x38
00000000`0012f480 00000001`4000b881 TestDefaultDebugger64!AfxCallWndProc+0xfe
00000000`0012f520 00000000`77c43abc TestDefaultDebugger64!AfxWndProc+0x59
00000000`0012f560 00000000`77c4337a user32!UserCallWinProcCheckWow+0x1f9
00000000`0012f630 00000000`77c4341b user32!SendMessageWorker+0x68c
00000000`0012f6d0 000007ff`7f07c89f user32!SendMessageW+0x9d
00000000`0012f720 000007ff`7f07f2e1 comctl32!Button_ReleaseCapture+0x14f
00000000`0012f750 00000000`77c43abc comctl32!Button_WndProc+0xd51
00000000`0012f8b0 00000000`77c43f5c user32!UserCallWinProcCheckWow+0x1f9
00000000`0012f980 00000000`77c3966a user32!DispatchMessageWorker+0x3af
00000000`0012f9f0 00000001`40007148 user32!IsDialogMessageW+0x256
00000000`0012fac0 00000001`400087f8 TestDefaultDebugger64!CWnd::IsDialogMessageW+0x38
00000000`0012faf0 00000001`4000560f TestDefaultDebugger64!CWnd::PreTranslateInput+0x28
00000000`0012fb20 00000001`4000b2ca TestDefaultDebugger64!CDialog::PreTranslateMessage+0xc3
00000000`0012fb50 00000001`400034a7 TestDefaultDebugger64!CWnd::WalkPreTranslateTree+0x3a
00000000`0012fb80 00000001`40003507 TestDefaultDebugger64!AfxInternalPreTranslateMessage+0x67
00000000`0012fbb0 00000001`400036d2 TestDefaultDebugger64!AfxPreTranslateMessage+0x23
00000000`0012fbe0 00000001`40003717 TestDefaultDebugger64!AfxInternalPumpMessage+0x3a
00000000`0012fc10 00000001`4000a806 TestDefaultDebugger64!AfxPumpMessage+0x1b
00000000`0012fc40 00000001`40005ff2 TestDefaultDebugger64!CWnd::RunModalLoop+0xea
00000000`0012fca0 00000001`40001163 TestDefaultDebugger64!CDialog::DoModal+0x1c6
00000000`0012fd50 00000001`4002ccb1 TestDefaultDebugger64!CTestDefaultDebuggerApp::InitInstance+0xe3
00000000`0012fe80 00000001`40016150 TestDefaultDebugger64!AfxWinMain+0x75
00000000`0012fec0 00000000`77d5964c TestDefaultDebugger64!__tmainCRTStartup+0x260
00000000`0012ff80 00000000`00000000 kernel32!BaseProcessStart+0x290:000> dqs 000000000012f198-20 000000000012f198+20
00000000`0012f178 00000001`4000bc25 TestDefaultDebugger64!CWnd::ReflectLastMsg+0x65
00000000`0012f180 00000000`00080334
00000000`0012f188 00000000`00000006
00000000`0012f190 00000000`0000000d
00000000`0012f198 00000001`40004ba0 TestDefaultDebugger64!_AfxDispatchCmdMsg+0xc4
00000000`0012f1a0 ffffffff`fffffffe
00000000`0012f1a8 00000000`00000000
00000000`0012f1b0 00000000`00000000
00000000`0012f1b8 00000000`00000000We see that there are no saved SS:RSP, RFLAGS, CS:RIP registers which we see on a stack if an exception happens in kernel mode as shown in part 2. If we bugcheck our system using SystemDump tool to generate complete memory dump at that time we can look later at the whole thread that experienced exception in user mode and its user mode and kernel mode stacks:
kd> !process fffffadfe7055c20 2
PROCESS fffffadfe7055c20
SessionId: 0  Cid: 0c64    Peb: 7fffffd7000  ParentCid: 07b0
DirBase: 27e3d000  ObjectTable: fffffa800073a550  HandleCount:  55.
Image: TestDefaultDebugger64.exe
THREAD fffffadfe78f2bf0 Cid 0c64.0c68 Teb: 000007fffffde000 Win32Thread: fffff97ff4d71010 WAIT: (Unknown) KernelMode Non-Alertable
SuspendCount 1
fffffadfdf7b6fc0 SynchronizationEvent THREAD fffffadfe734c3d0 Cid 0c64.0c88 Teb: 000007fffffdc000 Win32Thread: 0000000000000000 WAIT: (Unknown) KernelMode Non-Alertable
SuspendCount 1
FreezeCount 1
fffffadfe734c670 Semaphore Limit 0x2kd> .thread /r /p fffffadfe78f2bf0
Implicit thread is now fffffadf`e78f2bf0
Implicit process is now fffffadf`e7055c20
Loading User Symbolskd> kL 100
Child-SP RetAddr Call Site
fffffadf`df7b6d30 fffff800`0103b063 nt!KiSwapContext+0x85
fffffadf`df7b6eb0 fffff800`0103c403 nt!KiSwapThread+0xc3
fffffadf`df7b6ef0 fffff800`013a9dc1 nt!KeWaitForSingleObject+0x528
fffffadf`df7b6f80 fffff800`01336dcf nt!DbgkpQueueMessage+0x281
fffffadf`df7b7130 fffff800`01011c69 nt!DbgkForwardException+0x1c5
fffffadf`df7b74f0 fffff800`0104146f nt!KiDispatchException+0x264
fffffadf`df7b7af0 fffff800`010402e1 nt!KiExceptionExit
fffffadf`df7b7c70 00000001`40001690 nt!KiPageFault+0×1e1
00000000`0012f198 00000001`40004ba0 TestDefaultDebugger64!CTestDefaultDebuggerDlg::OnBnClickedButton1
00000000`0012f1a0 00000001`40004de0 TestDefaultDebugger64!_AfxDispatchCmdMsg+0xc4
00000000`0012f1d0 00000001`4000564e TestDefaultDebugger64!CCmdTarget::OnCmdMsg+0×180
00000000`0012f230 00000001`4000c6b4 TestDefaultDebugger64!CDialog::OnCmdMsg+0×32
00000000`0012f270 00000001`4000d4d8 TestDefaultDebugger64!CWnd::OnCommand+0xcc
00000000`0012f300 00000001`400082e0 TestDefaultDebugger64!CWnd::OnWndMsg+0×60
00000000`0012f440 00000001`4000b77a TestDefaultDebugger64!CWnd::WindowProc+0×38
00000000`0012f480 00000001`4000b881 TestDefaultDebugger64!AfxCallWndProc+0xfe
00000000`0012f520 00000000`77c43abc TestDefaultDebugger64!AfxWndProc+0×59
00000000`0012f560 00000000`77c4337a USER32!UserCallWinProcCheckWow+0×1f9
00000000`0012f630 00000000`77c4341b USER32!SendMessageWorker+0×68c
00000000`0012f6d0 000007ff`7f07c89f USER32!SendMessageW+0×9d
00000000`0012f720 000007ff`7f07f2e1 COMCTL32!Button_ReleaseCapture+0×14f
00000000`0012f750 00000000`77c43abc COMCTL32!Button_WndProc+0xd51
00000000`0012f8b0 00000000`77c43f5c USER32!UserCallWinProcCheckWow+0×1f9
00000000`0012f980 00000000`77c3966a USER32!DispatchMessageWorker+0×3af
00000000`0012f9f0 00000001`40007148 USER32!IsDialogMessageW+0×256
00000000`0012fac0 00000001`400087f8 TestDefaultDebugger64!CWnd::IsDialogMessageW+0×38
00000000`0012faf0 00000001`4000560f TestDefaultDebugger64!CWnd::PreTranslateInput+0×28
00000000`0012fb20 00000001`4000b2ca TestDefaultDebugger64!CDialog::PreTranslateMessage+0xc3
00000000`0012fb50 00000001`400034a7 TestDefaultDebugger64!CWnd::WalkPreTranslateTree+0×3a
00000000`0012fb80 00000001`40003507 TestDefaultDebugger64!AfxInternalPreTranslateMessage+0×67
00000000`0012fbb0 00000001`400036d2 TestDefaultDebugger64!AfxPreTranslateMessage+0×23
00000000`0012fbe0 00000001`40003717 TestDefaultDebugger64!AfxInternalPumpMessage+0×3a
00000000`0012fc10 00000001`4000a806 TestDefaultDebugger64!AfxPumpMessage+0×1b
00000000`0012fc40 00000001`40005ff2 TestDefaultDebugger64!CWnd::RunModalLoop+0xea
00000000`0012fca0 00000001`40001163 TestDefaultDebugger64!CDialog::DoModal+0×1c6
00000000`0012fd50 00000000`00000000 TestDefaultDebugger64!CTestDefaultDebuggerApp::InitInstance+0xe3Dumping kernel mode stack of our thread shows that the processor saved registers there:
kd> dqs fffffadf`df7b7c70  fffffadf`df7b7c70+200
fffffadf`df7b7c70  fffffadf`e78f2bf0
fffffadf`df7b7c78  00000000`00000000
fffffadf`df7b7c80  fffffadf`e78f2b01
fffffadf`df7b7c88  00000000`00000020
...
...
...
fffffadf`df7b7d90  00000000`00000000
fffffadf`df7b7d98  00000000`00000000
fffffadf`df7b7da0  00000000`00000000
fffffadf`df7b7da8  00000000`00000000
fffffadf`df7b7db0  00000000`001629b0
fffffadf`df7b7db8  00000000`00000001
fffffadf`df7b7dc0  00000000`00000001
fffffadf`df7b7dc8  00000000`00000111 ; RBP saved by KiPageFault
fffffadf`df7b7dd0  00000000`00000006 ; Page-Fault Error Code
fffffadf`df7b7dd8  00000001`40001690 TestDefaultDebugger64!CTestDefaultDebuggerDlg::OnBnClickedButton1 ; RIP
fffffadf`df7b7de0  00000000`00000033 ; CS
fffffadf`df7b7de8  00000000`00010246 ; RFLAGS
fffffadf`df7b7df0  00000000`0012f198 ; RSP
fffffadf`df7b7df8  00000000`0000002b ; SS
fffffadf`df7b7e00  00000000`0000027f
fffffadf`df7b7e08  00000000`00000000
fffffadf`df7b7e10  00000000`00000000
fffffadf`df7b7e18  0000ffff`00001f80
fffffadf`df7b7e20  00000000`00000000
fffffadf`df7b7e28  00000000`00000000
fffffadf`df7b7e30  00000000`00000000
fffffadf`df7b7e38  00000000`00000000
…
…
…
kd> .asm no_code_bytes
Assembly options: no_code_byteskd> u KiPageFault
nt!KiPageFault:
fffff800`01040100 push rbp
fffff800`01040101 sub rsp,158h
fffff800`01040108 lea rbp,[rsp+80h]
fffff800`01040110 mov byte ptr [rbp-55h],1
fffff800`01040114 mov qword ptr [rbp-50h],rax
fffff800`01040118 mov qword ptr [rbp-48h],rcx
fffff800`0104011c mov qword ptr [rbp-40h],rdx
fffff800`01040120 mov qword ptr [rbp-38h],r8Error code 6 is 110 in binary and volume 3A of Intel manual tells us that “the fault was caused by a non-present page” (bit 0 is cleared), “the access causing the fault was a write” (bit 1 is set) and “the access causing the fault originated when the processor was executing in user mode” (bit 2 is set).